
Researching and understanding the user and their environment is the first, and arguably most important, stage in the service design process. Service design purists will insist on the usage of interviews, observation, shadowing, and other ethnographic research methods in order to acquire this understanding. These methods work well, but do they work when trying to understand the organisations with users who number in the millions? The service design event “Data-Driven Design” argued, that qualitative data alone cannot provide large organisations with the necessary knowledge. These organisations rely heavily on quantitative data.
This Service Design Network event consisted of speakers from two large companies answering the question: What is data-driven design? The first speaker, Iiris Lahti from the media conglomerate Sanoma, discussed how design can be data-driven in the current media landscape. The second talk was held by Jussi Mantere and Hanna-Reetta Lukkainen of K-Ryhmä, which together with S-Group controls practically the entire food retail industry in Finland and has branches abroad as well.
What is Data-driven design at Sanoma
Sanoma tracks their users in a variety of ways: from the ways they navigate their news website and the popular Vauva.fi forums; to their media consumption on the Ruutu app and physical subscriptions to their publications. It goes without saying, that Sanoma has a lot of data on its users. The key question is: what do they do with this data and how to they provide ever-more value with this acquired knowledge?
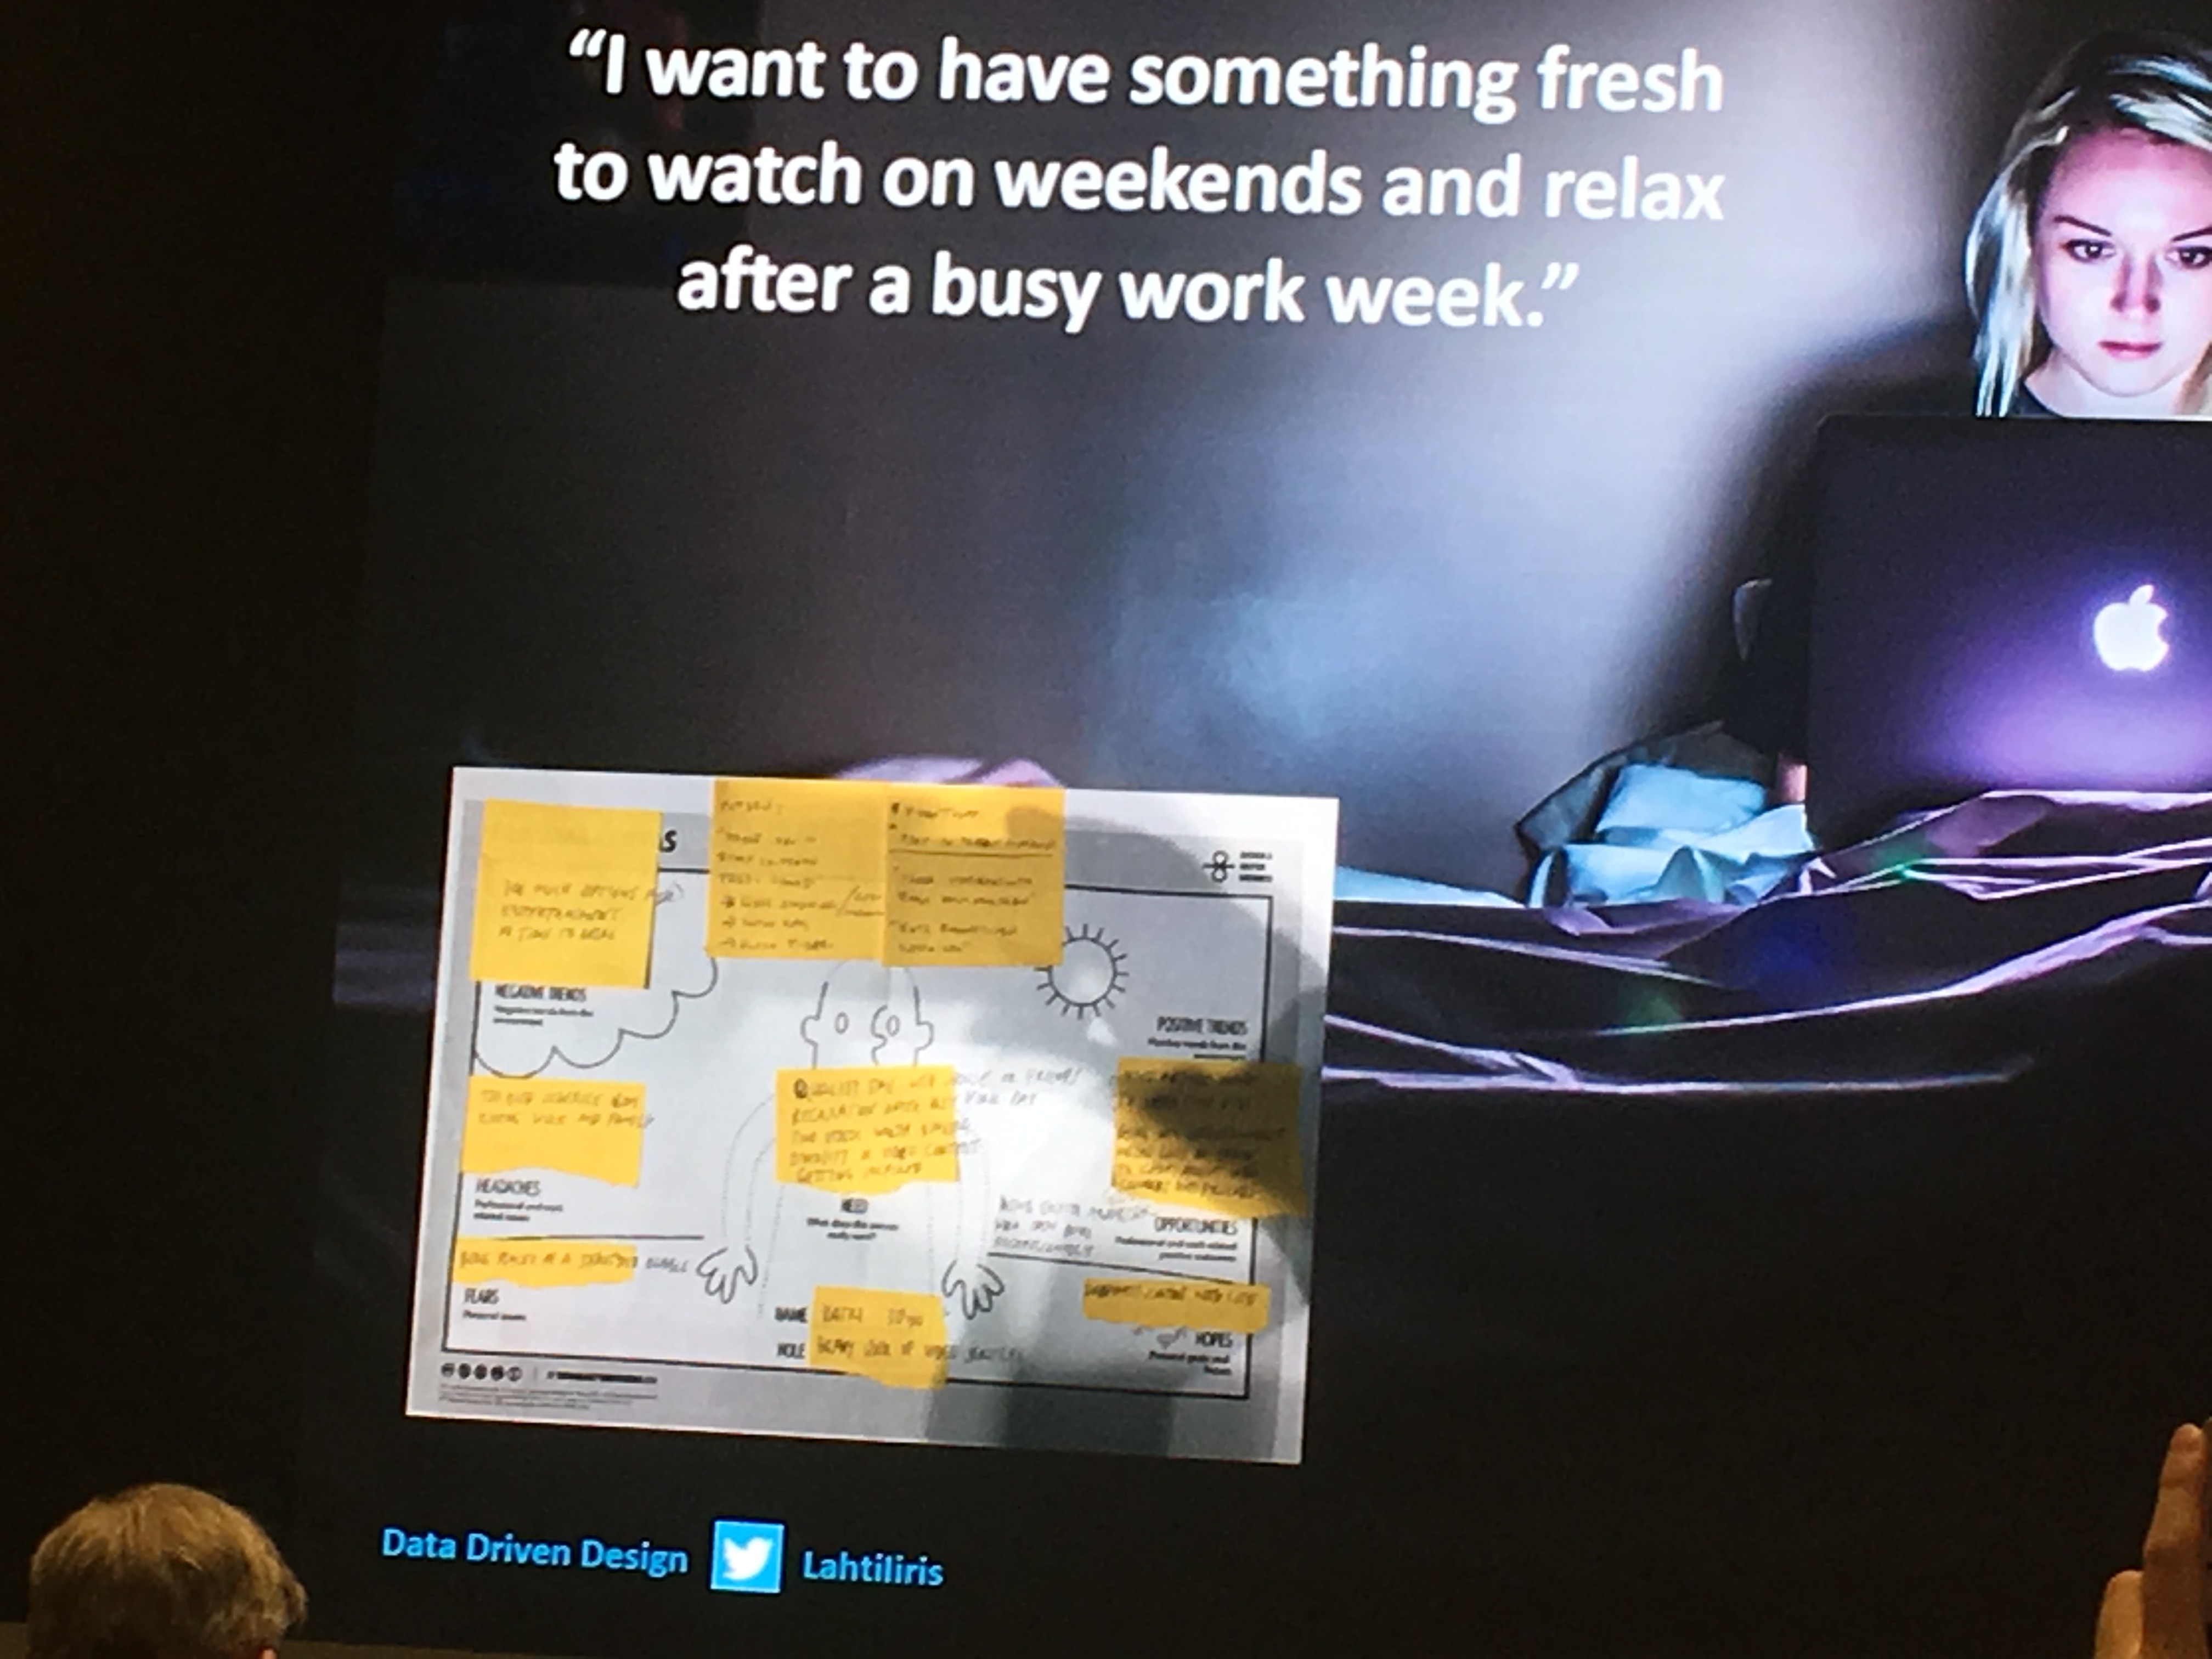
Iiris described perpetually trying to find the sweet spot between service design, data analytics and customer surveys. She mentioned how when these three areas work well together, then their users (and Sanoma) thrive. An interesting example mentioned was through qualitative interviews concerning the Ruutu media streaming app. Briefly: A user stated her need for being passively entertained after work whilst simultaneously wanting to be surprised and not wanting to watch the same familiar shows repeatedly. Out of this small insight, Ruutu created a “suggest something else” button, which essentially acts like a shuffle button after an episode or film has ended. This is exactly the kind of out-of-the-blue concept which can only come from qualitative insights and not from tracking data. Iiris summed it up as finding the unknown unknowns. To elaborate on this, quantitative data can be used to discover known unknows such as the likelihood that someone who likes Downton Abby will also like the The Simpsons. However, this kind of research cannot be used for unkown unkowns. Unknown unknowns would be more open-ended questions such as “How can Ruutu provide more value to user X”. Quantitative data can rarely be used to satisfactorily answer these deeper questions.
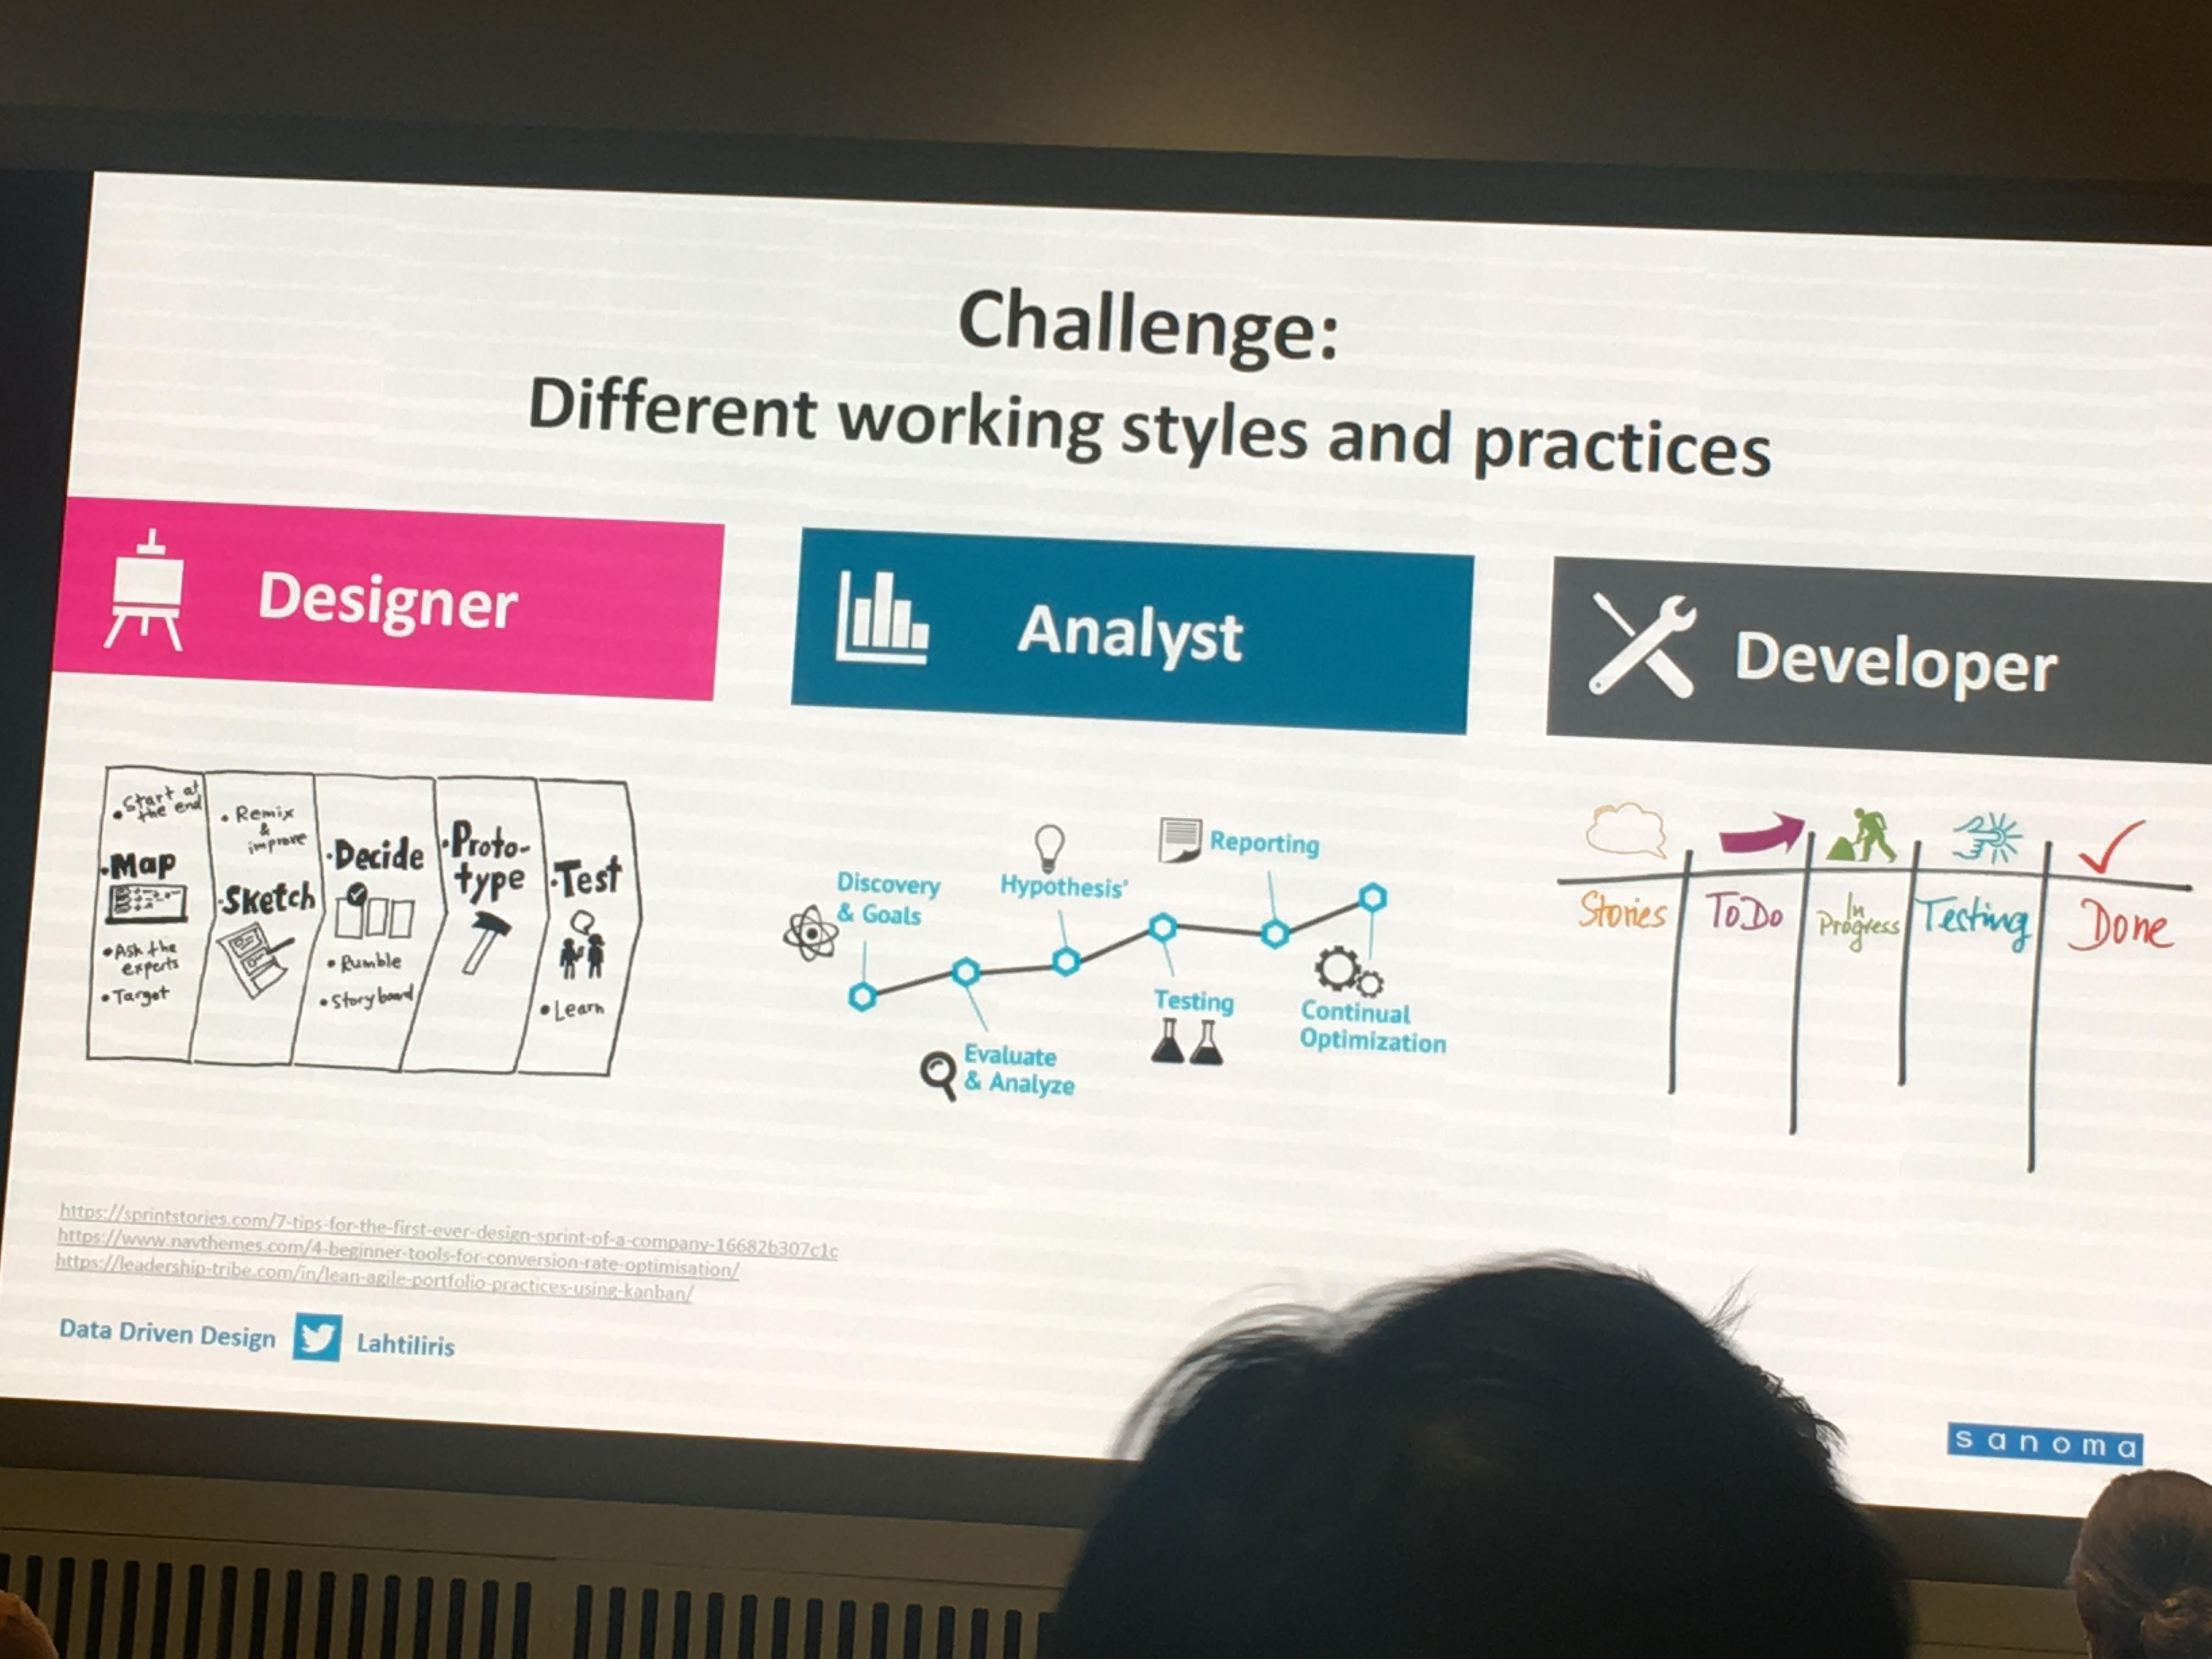
Iiris, herself a data scientist, has a slide which described an obstacle I am trying to overcome at work: How to integrate the working processes of Designers, Analysts, and Developers. These three groups operate with similar, but not quite the same, working processes. To solve this Sanoma uses the “Sanoma Development Framework” which Iiris admitted is still work in progress.
What is Data-driven design at K-Ryhmä
Jussi and Hanna used the analogy of the compass to describe how they use data at K-Ryhmä. They summarised their thinking as “data gives insights, design gives solutions”. Despite one speaker being a designer and one speaker being a data scientist, they considered quantitative and qualitative data as being just data. Only when asked at the end did they distinguish between the two and mentioned the benefits of combining them.
Perhaps the most interesting specific cases both of them mentioned had to do with how they use data to empower their customers. Rather than simply utilising tracking and other data points to accumulate information and insights on their customers they have created many ways in which the data can be put to use for the direct benefit of their customers and partners. The cases they mentioned related to the creation of a new drink, making their retailers more independent, and a customer-facing app.
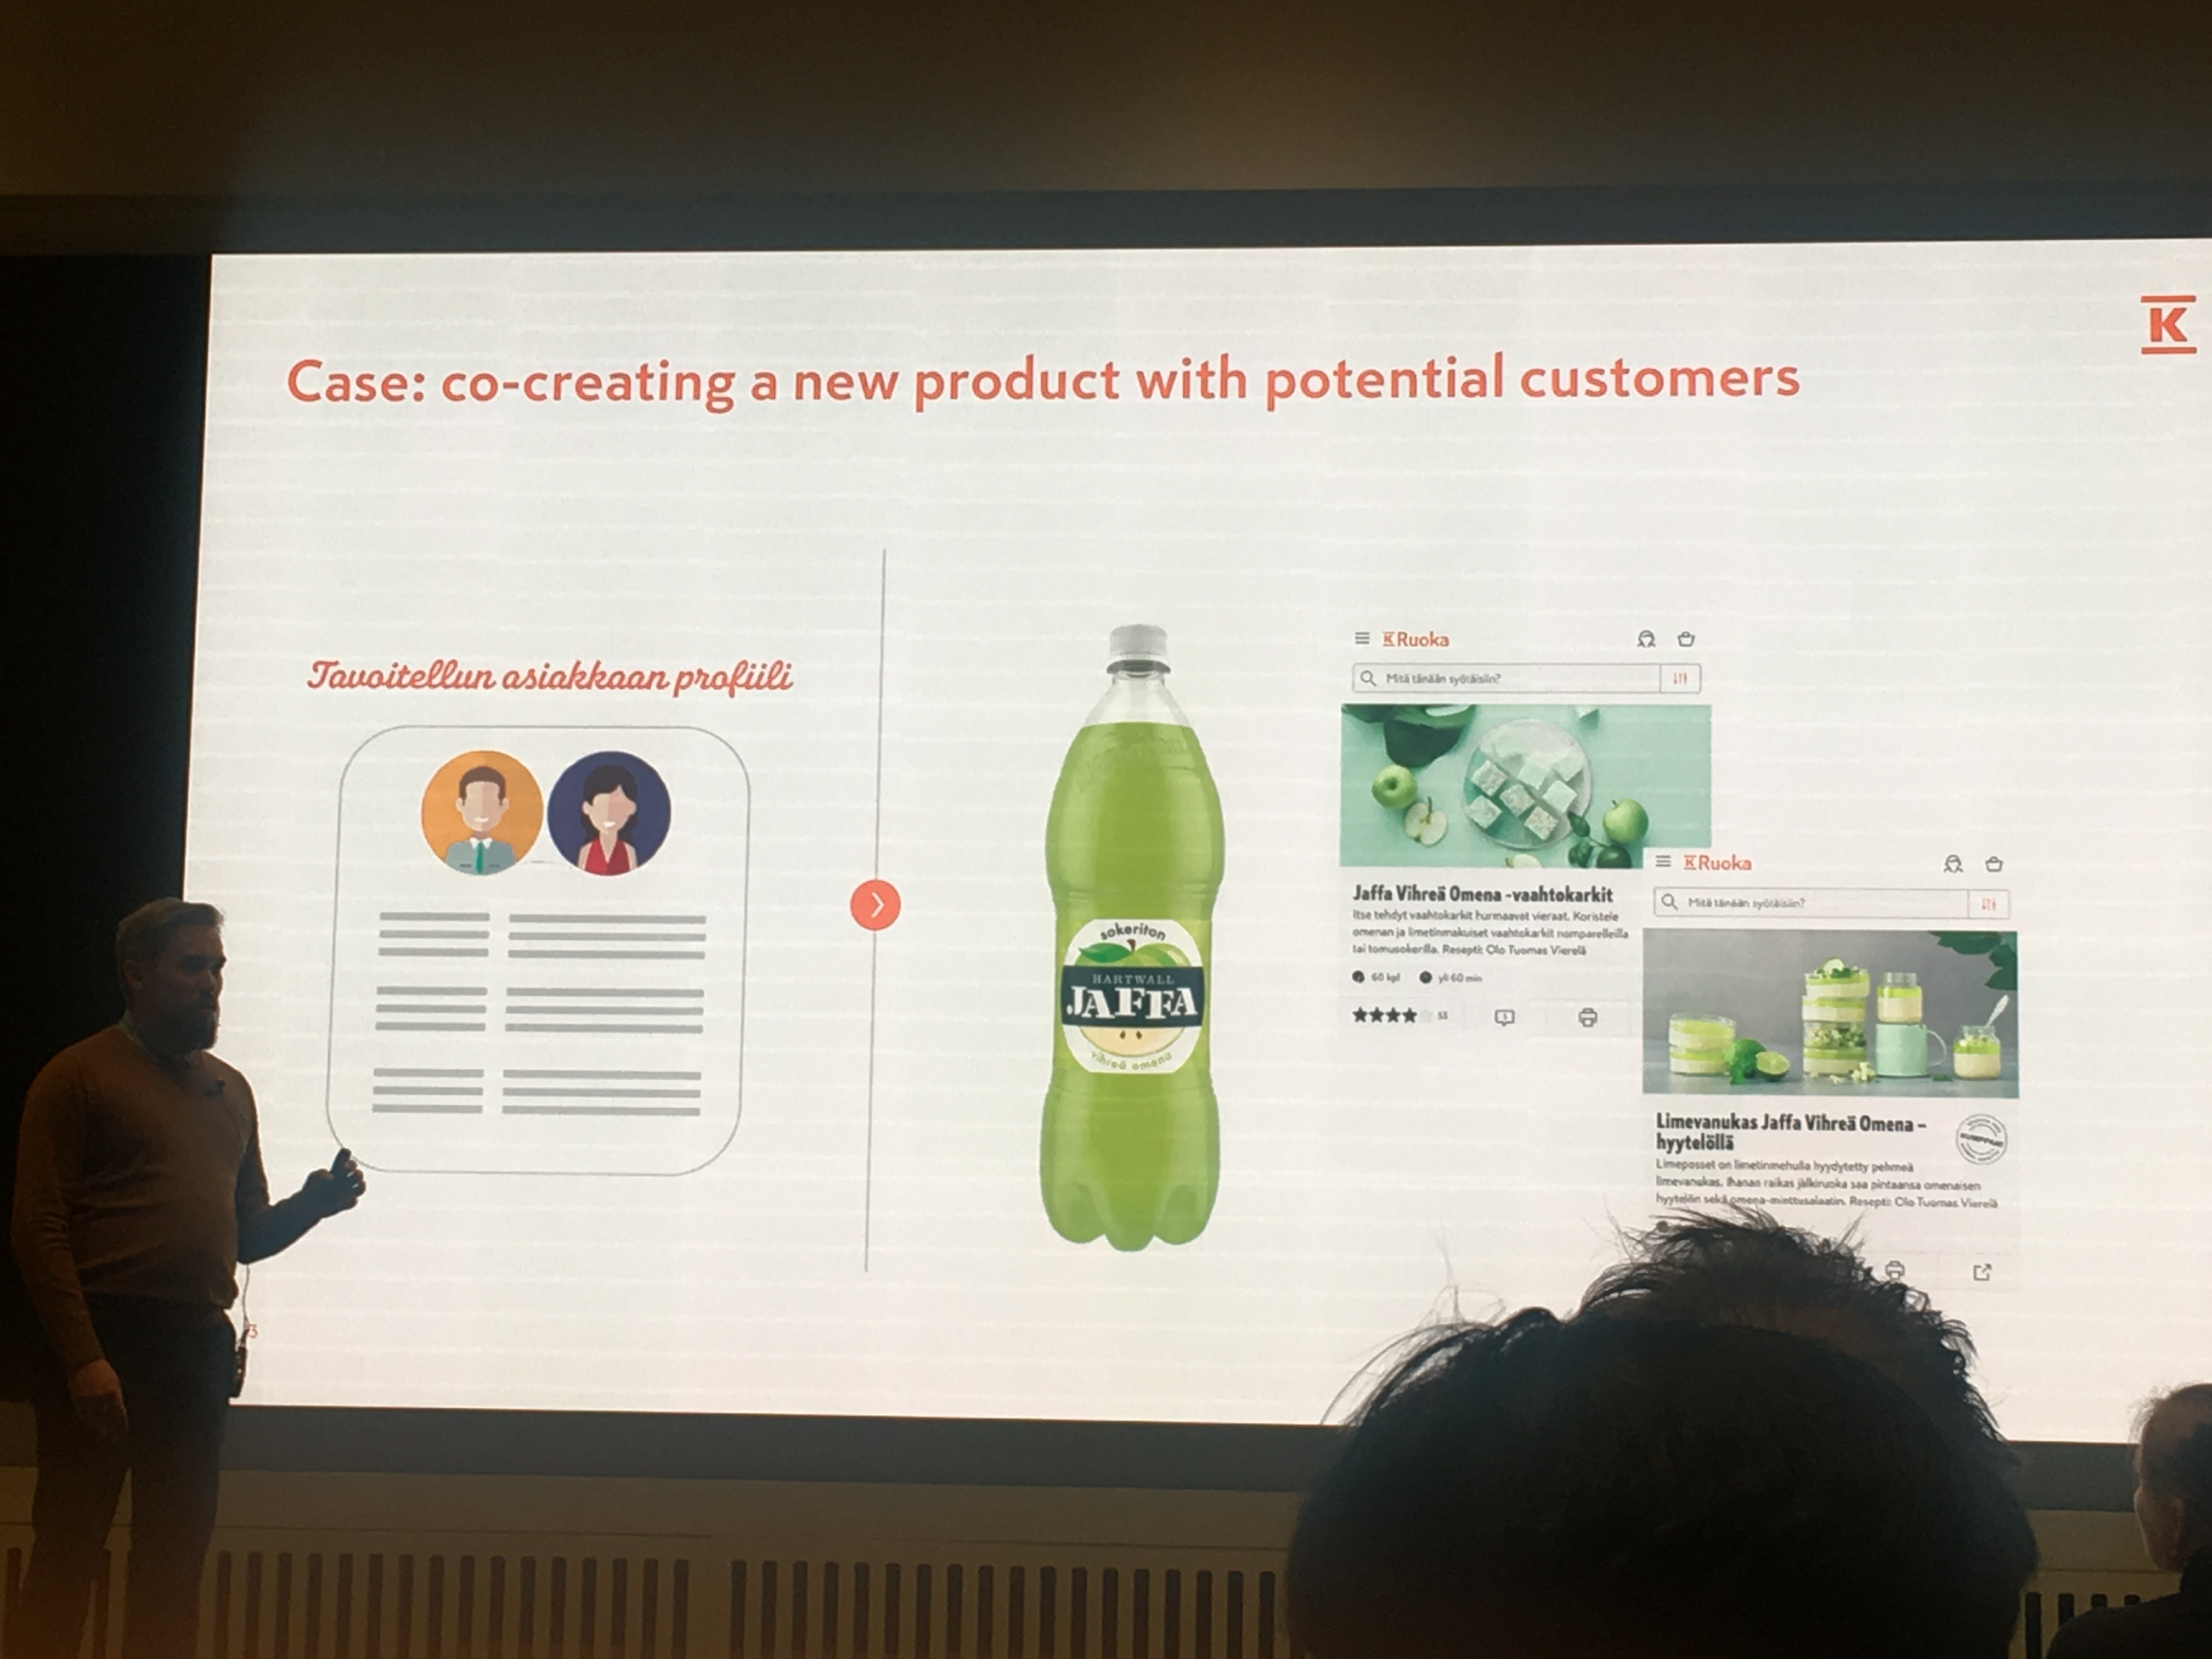
They mentioned co-creating a new sugarfree drink with a leading drinks company. Using their data and knowledge of their customers they had spotted a need and used to it to co-develop an exclusive new drink sold only in K-Ryhmä stores. It is not uncommon for a new product or service to be created through the using of finding needs or holes in the market, in fact this is the basics of service design. What is unusual in this case is that K-Ryhmä was willing to share data on its customers for the mutual benefit of K-Ryhmä and the drinks company (and presumably the customers desiring the new drink).
K-Ryhmä operates what is essentially a franchise. Each store owner operates more-or-less independently but licenses the K brand and operating systems. This implies that the K-Ryhmä itself is an intriguing service ecosystem with many layers of co-dependent stakeholders all under one brand. As a brand it is of utmost importance for K-Ryhmä to keep its retail owning partners profitable and satisfied. Because of this the brand offers each retailer a dashboard of its own data and trains them in its usage. This empowers each retailer discover what makes their specific customers unique. At a deeper level it gives them even more freedom to take ownership of their slice of the K brand and to act on it for mutual benefit.

K-Ostokset is an app released in the last half year. It provides a dashboard to customers with a K loyalty card to see what they’ve bought, how much they’ve spent, and when. With this initial description it struck me as a quite standard customer-facing dashboard app. However, they have added additional functionality which I find truly interesting. Customers can use their personal shopping habits and set specific targets. This goes beyond simply spend X amount of money on food next month. Customers can set targets based on their personal values. For example, they can track and set goals to purchase more Finnish products and (before the end of the year we were promised) to reduce their impact on climate change. The speakers did confess to being initially hesitant, as data privacy is an understandable concern amongst many consumers nowadays and displaying how much they have been tracked may scare customers. However, I feel this is a brave move by K-Ryhmä as it displays a fundamentally deep understanding of their customers: people no longer shop based merely on price, flavour, or health. Today customers are values-based shoppers: morality, locality, niche-diets, politics, convenience and other factors all play a large role in why customers buy what they do. Considering the size of K-Ryhmä, this app has the potential to change the way a large portion of the Finnish population shops hopefully for the better.

The event as a whole tried to inspire new ways of seeing how data and design can not only coexist but thrive in large companies. The heavy usage of quantitative data at these organisations does not replace service design’s usage of qualitative research. Instead, companies the size of Sanoma and K-Ryhmä have learned to use the strengths of both research gathering processes in a manner which enhances the value they can provide to their users.

Leave a comment