
New time requires new ways to manage, and design thinking can provide managers human-centeric tools to participate all stakeholders in finding opportunities.
Visualizing divergent ideas for a holistic view
Creating innovative solutions to business challenges requires companies to see the big picture: what players affect the market or industry outside of it through technical possibilities or how the way people use and want to use products and services changes. Design thinking can be described as a way of combining rational, data-based thinking with intuitive knowledge to form insight into business opportunities. It is also a way of analyzing business models, networks, behavior, emotions and peoples’ interaction with each other and the product or service company provides. (Mootee. 2013, 39.) Design thinking tools can help think more broadly and come up with divergent ideas.

Mindshake’s Evolution 6^2 method proposes tools like mindmap to detect opportunities (Tschimmel. 2019, 50.). In our classroom exercise at Design Thinking course we tried opportunity mindmap and it revealed that as the branches of mindmap grew longer, more novel possibilities started to emerge. Links between different aspects were easy to spot from the canvas.
Visual design thinking tools for testing and sharing concepts
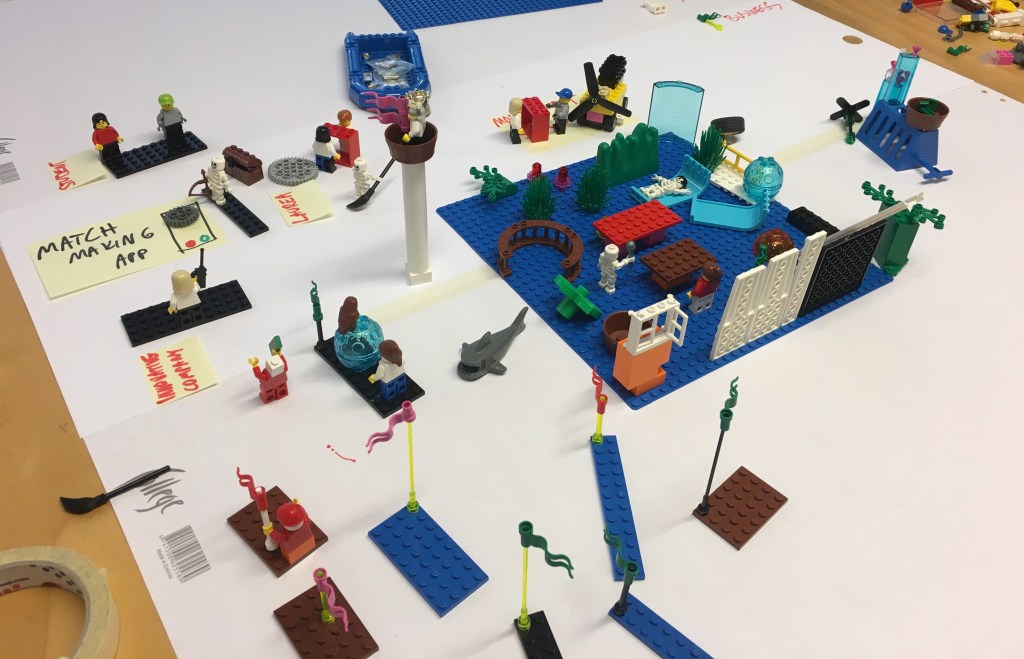
Rapid prototyping is a tool to try the solution fast, with materials at hand (Tschimmel. 2019, 71, 76). The purpose of the prototype is to find out the pros and cons of the idea and see if there are new paths the new versions could take (Brown. 2008, 87.). In businesses, innovation teams should be encourage to create a prototype withing a week of starting the project (Brown. 2008, 90.). We used Lego to visualize the different stakeholders, processes and behaviors needed in the solution. Mootee (2013, 184) states that “Spreadsheets won’t provide users the ability to see the entire supply and demand relationship and it is the reason why so many new business models fail, even though they look robust on a spreadsheet and in PowerPoint.”
When prototyping we found many new aspects and problems in the model we had been designing: there were dots that needed connecting, stakeholders totally missing from where they obviously were needed. Prototype was then used for desktop walkthrough where we presented the solution to our fellow students: excellent way to use both storytelling and visualization to communicate complex system. This type of role play or storytelling makes it easier to understand how things are connected and what type of behavior and processes are needed to get from the challenge to the solution (Mootee. 2013, 90.).

Visual business model includes the elements of traditional business model using only drawing and no text (Tschimmel. 2019, 76). In the beginning of creating business model it was apparent, that because our shared understanding of the concept was still too vague, it was also impossible to draw all resources and revenue streams. I think this is also the reason why it is sometimes hard for management to get whole organization to commit to new vision, plan or concept: strategies are often so intangible, that it is impossible to understand what one is supposed to do.

Storytelling is one tool for communicating new strategy.(Mootee. 2013, 87.) Visual storyboarding tells the story of how the new concept works from visualizing customer’s current unmet need, the solution and end-result of this new concept from customer’s perspective (Tschimmel. 2019, 15.).
Visualizing new ideas helps to innovate
It is relevant to combine unexpected ideas and branch out to do big changes and create innovation that leads to innovation majorly impacting the bottom line as well as sales and profits. Brown (2008, 91) suggest that to succeed in innovation, businesses need to mix incremental innovation more typical to business units and disruptive innovations starting from top management initiative. Using design thinking tools to visualize new concepts provides a great opportunity for any type of business, and helps managers collaborate with all stakeholders in an interesting, tangible way. Mindshake’s Evolution 6^2 tools can be found online. I encourage you to try these!
Written by Eeva Honkala, Service Innovation and Design Master degree programme student.
References.:
- Mootee, I. 2013. Design Thinking for Strategic Innovation: What They Can’t Teach You at Business or Design School. New Jersey: John Wiley & Sons, Inc. Ebook. https://laurea.finna.fi/Record/nelli01.2550000001111847
- Brown, T. 2008. Design Thinking. Harvard Business Review, June, 84-95. http://www.ideo.com/images/uploads/thoughts/IDEO_HBR_Design_Thinking.pdf
- Tschimmel, K. 2019. Master Class Practical Design Thinking, Laurea UAS, SID, Espoo, Finland. 2019.

Leave a comment